Healthcare Retail Analytics · Power BI · DAX · Data Modeling
Pharmacy Sales & Profitability
Overview
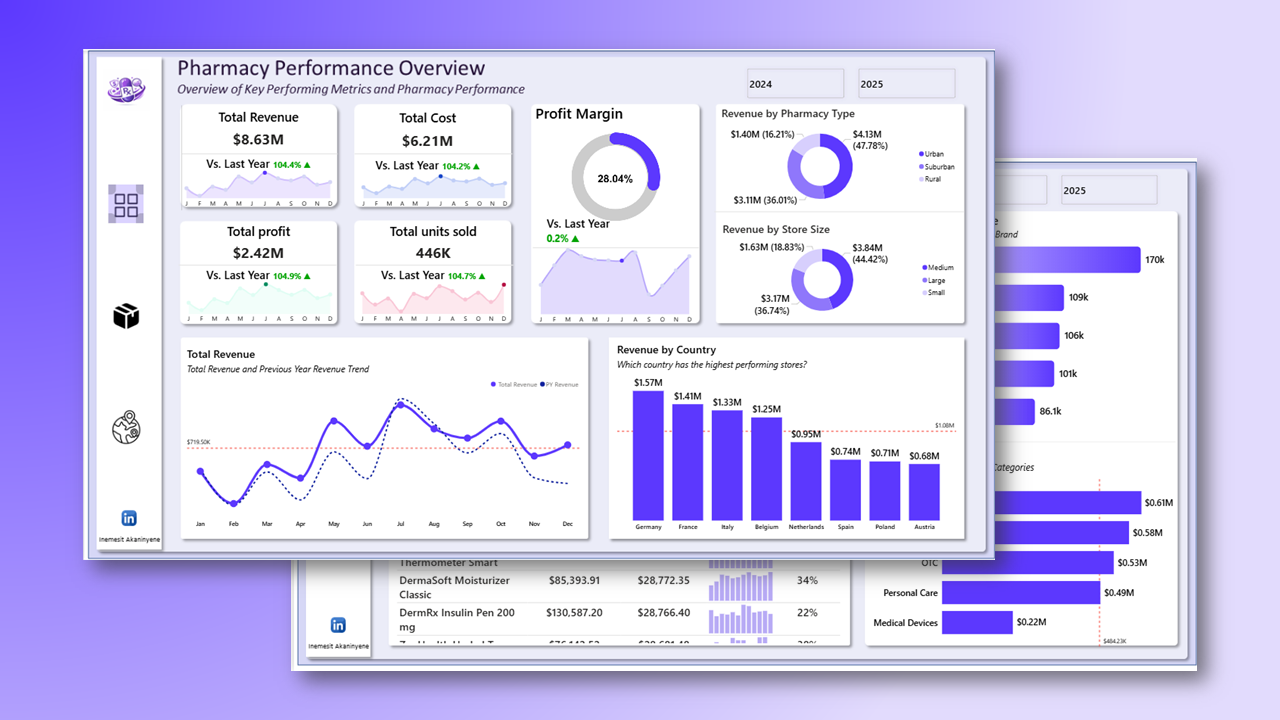
An interactive multi-page dashboard examining pharmacy network performance across revenue, profitability, product mix and geographic distribution. The model links dimension and fact tables (products, locations, dates, sales) to enable dynamic slicing across any combination of store type, region, brand and time period.
Key Metrics
Methodology
Data Preparation (Power Query)
Standardised all tables, removed duplicates, ran null checks and cleaned text fields before loading into the model.
Star Schema Modeling
Built a dimension-fact structure connecting products, pharmacy locations, dates and sales data, enabling clean many-to-one relationships and reliable aggregations.
Visualisation Mix
KPI cards for headline metrics, line and bar charts for trend analysis, donut charts for revenue share, and ranked tables for brand and product performance.
Key Findings
- 1
Germany, France and Italy drive the majority of revenue; Poland and Austria significantly underperform, likely for structural reasons beyond market size.
- 2
Urban pharmacies are the dominant revenue contributors; medium-sized formats show the strongest operational efficiency.
- 3
AntiBioX leads brand profitability; PainLess and GlucoSafe provide strong support in the top tier.
- 4
Prescription products dominate category revenue; Medical Devices lag significantly and represent an untapped or declining segment.
- 5
Revenue peaks mid-year (June–July) then declines toward year-end, a seasonality pattern that inventory strategy should address.
- 6
Year-over-year revenue growth exceeded 104%, reflecting strong underlying demand, though margin sustainability requires monitoring.
Recommendations
Expand aggressively in Germany, France and Italy; the unit economics support further investment in top-performing regions.
Investigate Poland and Austria underperformance: pricing, product mix or distribution issues may explain the gap.
Scale the AntiBioX / PainLess brand relationship; these are the margin drivers.
Audit Medical Devices: either revitalise the category with targeted ranging or reduce shelf space in favour of high-margin lines.
Build mid-year inventory peaks into procurement planning; introduce year-end promotions to counter the seasonal decline.
Live dashboard
Open in Power BI