Global Retail Analytics · Power BI · DAX · Power Query
Nexora Electronics: Global Sales BI
Overview
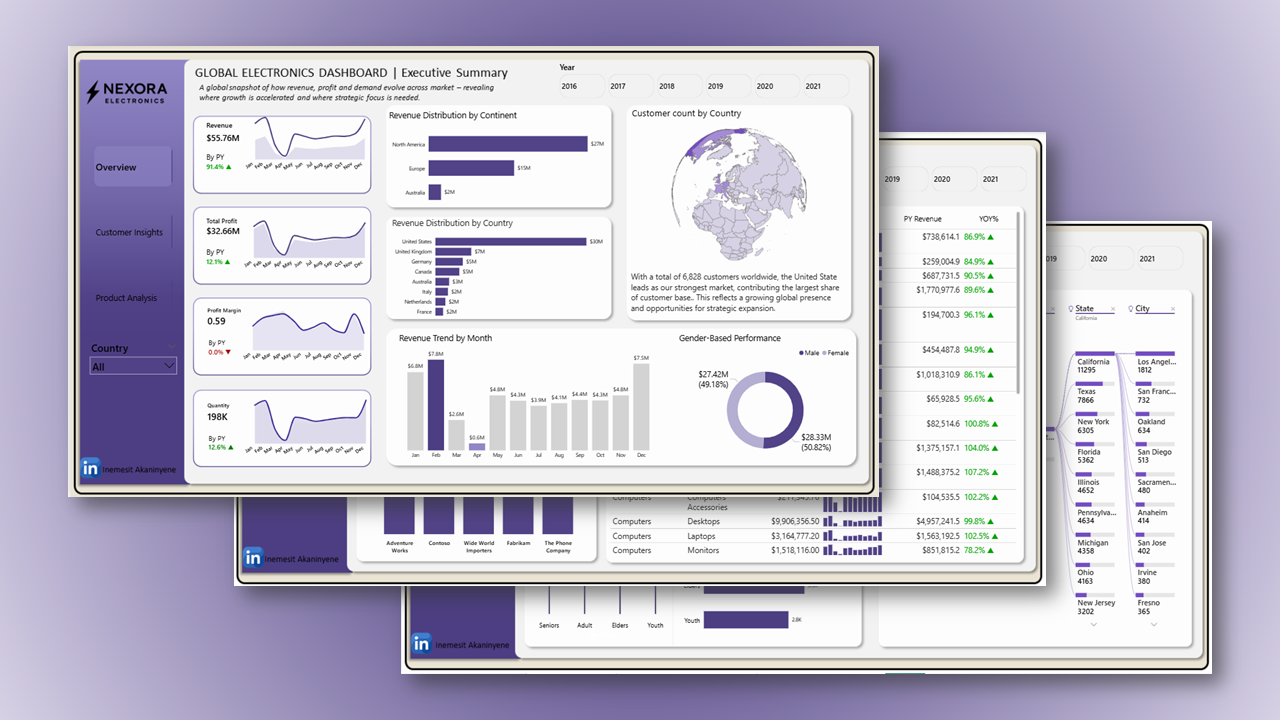
Six years of transactional, demographic and store performance data (2016–2021) for a global electronics retailer, synthesised into a three-page executive dashboard. The deliverable was designed to answer strategic questions about revenue growth quality, geographic risk and product portfolio health.
Key Metrics
Methodology
Data Preparation
Standardised data types, eliminated duplicates and nulls, cleaned text fields, merged tables for profit calculations and validated currency conversions across multiple geographies.
DAX Measures
Custom measures for revenue, profit, year-over-year growth percentages, customer counts and profit margins, each validated against source totals before publishing.
Executive Wireframe
A three-page report designed for executive-level storytelling: an overview page, a customer insights page and a product analysis page, each with a distinct narrative thread.
Key Findings
- 1
Revenue grew 91.4% YOY but profit grew only 12.1%, a classic margin compression signal that demands attention before the next growth phase.
- 2
The customer base stayed flat at ~15,000 despite the revenue surge, meaning growth was entirely price/volume-driven, not acquisition-driven.
- 3
The U.S. accounts for 70%+ of customers, a geographic concentration risk if any macro or competitive shock hits that market.
- 4
Revenue peaks sharply in February and December, then weakens May through August; inventory and staffing should mirror this pattern.
- 5
Cell phones and computers drove near-100% YOY growth; accessories remain undermonetised relative to their purchase frequency.
- 6
No single brand exceeds 21% revenue share, reflecting healthy supplier diversification that should be maintained.
Recommendations
Prioritise profitability over revenue; evaluate pricing strategy and cost structures before the next expansion.
Restart customer acquisition through referral programmes and loyalty incentives: volume growth cannot hide stagnant acquisition forever.
Diversify geographic presence beyond the U.S.-centric model to reduce concentration risk.
Align inventory and promotions with seasonal demand; build stock before February and December peaks.
Bundle accessories at point-of-sale to capture the undermonetised attach rate on device purchases.
Target Senior and Adult segments with tailored offerings; they show the strongest customer lifetime value metrics.
Live dashboard
Open in Power BI