UK E-Commerce · Executive BI · Power BI
E-Commerce Conversion & Sales Analytics
Overview
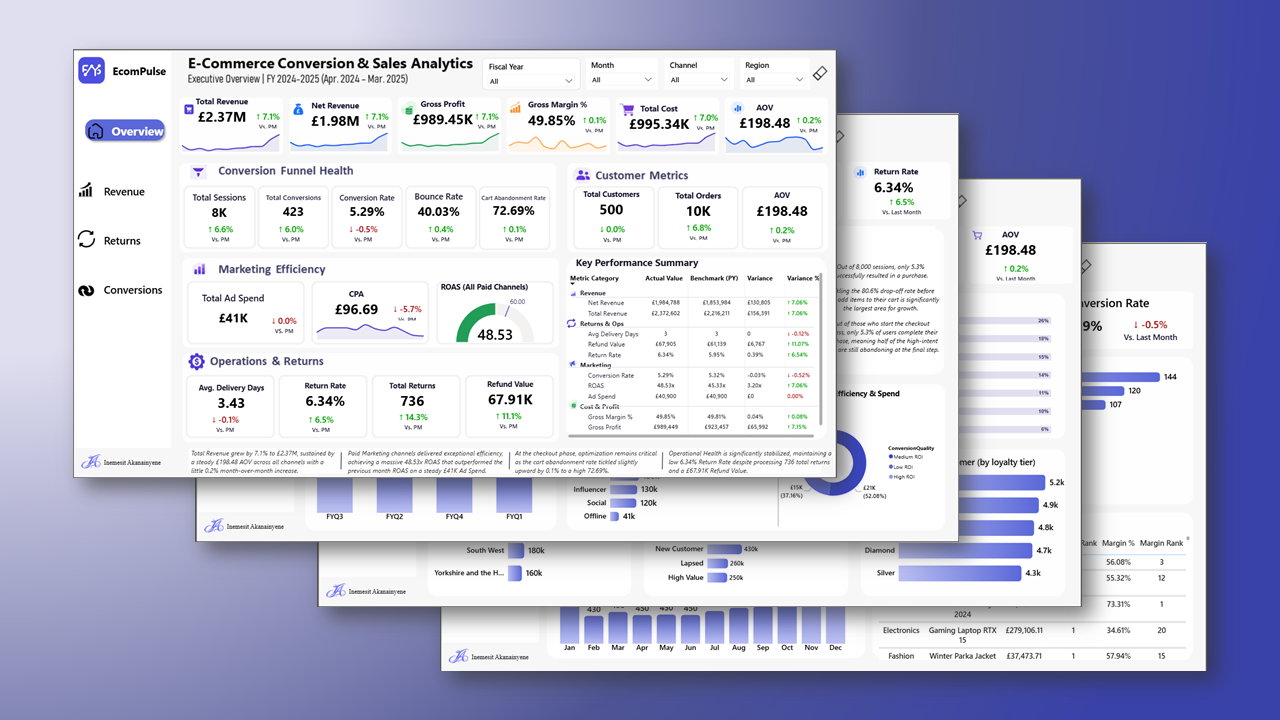
An executive-level Power BI report for a UK e-commerce business across FY 2024-2025, built from 13 interconnected tables (3 fact, 7 dimension, 3 bridge) spanning sessions, orders, returns, products, customers, marketing and regional data. Built to answer five strategic questions: is growth sustainable, where does the funnel leak, which channels earn their spend, why do products get returned, and how seasonal is the business.
Key Metrics
Methodology
Data Transformation
Normalised column types, replaced nulls with meaningful labels ("Unclassified" campaigns, "No Promotion" codes), and built calculated columns for chronological return-month sorting.
Data Modeling
Restructured 13 raw tables into a clean star-schema-style model: 3 fact tables, 7 dimension tables and 3 bridge tables, tested for reliable many-to-many relationships.
Funnel & Channel Analysis
Built session-to-purchase funnel tracking, channel-level ROAS comparisons and return-driver breakdowns to turn raw events into decision-ready visuals.
Key Findings
- 1
Of 8,000 total sessions, only 19.4% (1,549) added an item to cart - an 80.6% drop-off between landing and carting, the single largest point of friction in the funnel.
- 2
Cart abandonment sits at 72.69%, with roughly half of checkout abandoners dropping off after seeing shipping costs, pointing to pricing-transparency and payment friction.
- 3
Revenue is heavily seasonal: flat and under £0.2M/month from January to October before surging to nearly £0.4M in November-December, with FY Q3 (£960K) far outpacing FY Q1 (£390K).
- 4
53% of all returns trace back to internal control failures - faulty products (18%), not as described (15%), wrong item sent (14%) and damaged in transit (6%) - and returns spike sharply from October through December alongside holiday volume.
- 5
London generates £1.1M in revenue, nearly matching every other tracked region combined, while email marketing dramatically outperforms paid media (144x ROAS for newsletters vs. 3x for TV/OOH).
- 6
Diamond loyalty members spend less on average (£4.7K) than Bronze members (£4.8K), suggesting the loyalty tier structure isn't converting status into higher spend.
Recommendations
Combat cart abandonment with one-click checkout, upfront shipping-cost transparency, and automated recovery emails built on the same infrastructure driving 144x newsletter ROAS.
Tighten quality control at all warehouses, especially the dominant London site, and improve product imagery and sizing detail to cut "not as described" and faulty-item returns.
Reallocate ad spend away from low-ROAS channels like TV/OOH (3x) toward email, Bing search and mid-funnel retargeting, where returns are 20-40x higher.
Rebuild the loyalty program so Diamond and Platinum members get perks - free return shipping, early access - that actually justify and reward their tier.
Scale warehouse staffing and logistics capacity ahead of the FY Q3-Q4 transition to handle the predictable Q4 surge without fulfillment delays.
Live dashboard
Open in Power BI